Capital Flows in Perpetual Futures: Reading Long and Short Pressure
What capital flows mean
Many traders only watch whether price is going up or down. In perpetual futures, price is only the surface. The more useful question is where capital and leverage are moving.
Think of the market as a tug of war. Bulls want price to rise. Bears want price to fall. Capital flow helps you see which side has more positions, more leverage, and more pressure.
If BTC rises, the move may come from healthy buying. But it may also come from crowded leveraged longs chasing the move. These two situations look similar on a chart, but the risk is different.
Funding rate: which side is crowded
Funding rate is one of the most common indicators in perpetual futures.
- A positive funding rate usually means longs are paying shorts, so long demand may be stronger.
- A negative funding rate usually means shorts are paying longs, so short demand may be stronger.
This is not a simple buy or sell signal. Its main job is to show crowding.
If BTC has been rising and funding rate becomes very high, many traders may already be long. A sudden pullback can then trigger stop losses or liquidations. If BTC has been falling and funding rate stays negative, shorts may be crowded. A sharp rebound can force shorts to close.
The key idea is simple: funding rate tells you whether the market is becoming too one-sided.
Open interest: how much position is still open
Open interest, or OI, shows the total amount of futures positions that have not been closed.
You can think of OI as “how much money is still on the field.” When OI rises, more positions are entering. When OI falls, positions are leaving, either by closing voluntarily or by liquidation.
Price and OI should be read together:
| Price | OI | Simple reading | |------|----|----------------| | Up | Up | More traders are chasing longs; momentum may continue, but risk rises | | Up | Down | Could be short covering, not necessarily fresh buying | | Down | Up | More traders are chasing shorts; downside pressure may increase | | Down | Down | Longs may be exiting and leverage is being reduced |
Beginners do not need to overcomplicate OI. If price moves sharply while OI also jumps, leverage is entering and volatility may increase.
Volume: is the move active
Volume shows how much trading is actually happening. If price rises with higher volume, the move has more support. If price rises on weak volume, it may be only a short-term push.
A simple way to read it:
- Price up and volume up: the rise has more participation.
- Price up but volume low: the move may be fragile.
- Price down and volume up: selling pressure may be stronger.
- Price down but volume low: it may be a temporary pullback.
Some traders also watch CVD, which compares aggressive buying and aggressive selling. Beginners do not need to master it immediately. Just understand that it helps identify which side is more active.
Liquidation data: where volatility can expand
Liquidation is forced position closing. It matters because it can turn a normal move into a fast spike or drop.
If many traders use high leverage long positions, a price drop can trigger forced selling. That selling can push price down even faster. If many traders are short, a sudden rise can trigger short liquidations and push price upward.
This is why perpetual futures sometimes create sharp wicks. The market may not have changed because of news. It may simply be that one side was overleveraged and got liquidated.
Beginners do not need a complicated liquidation heatmap at first. It is enough to remember: when many traders crowd into one direction with high leverage, the opposite move becomes more dangerous.
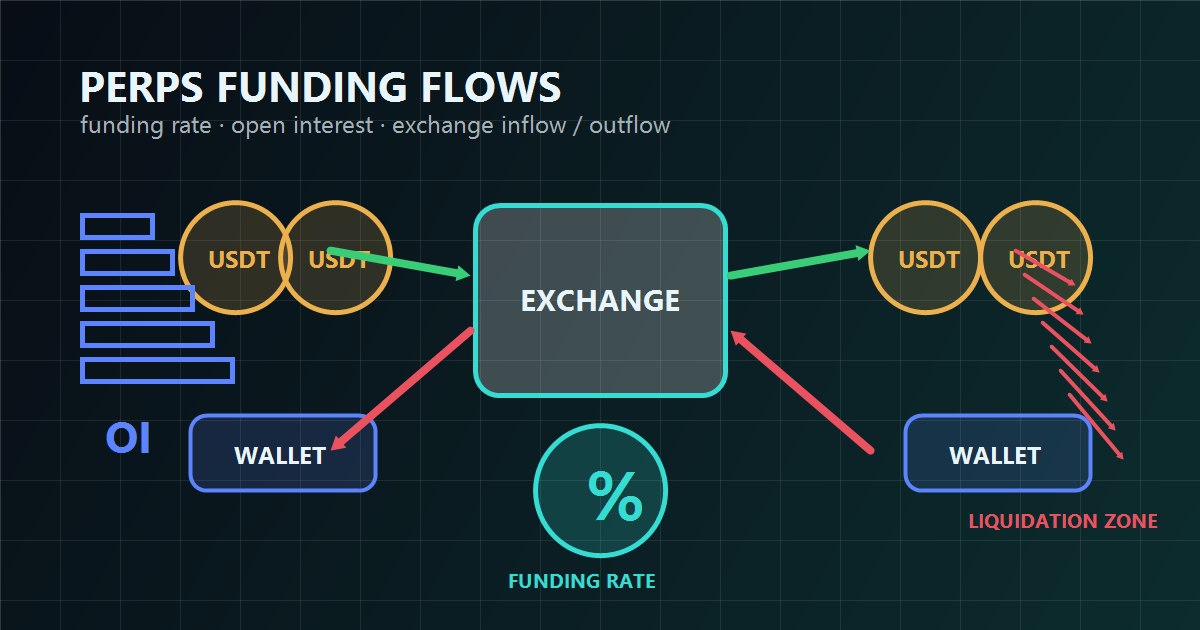
Exchange inflows and outflows
Exchange flows are another background signal.
Large USDT or USDC inflows may mean traders are preparing to trade or add margin. Large BTC or ETH inflows may mean someone is preparing to sell, or preparing to use assets as collateral.
But these signals cannot be used alone. Funds moving into an exchange do not guarantee immediate selling. Funds moving out do not guarantee price will rise. They are context, not a complete trading plan.
A simple reading order
If too many indicators feel confusing, use this order:
- Check price: is BTC rising, falling, or ranging?
- Check funding rate: are longs or shorts too crowded?
- Check OI: is leverage increasing quickly?
- Check volume: does the move have real activity?
- Check liquidation zones: where could forced closing happen?
This helps you avoid reacting to one candle and instead understand what is happening behind the move.
Conclusion
Capital flows in perpetual futures answer three questions: who is entering, which side is crowded, and where risk may appear.
Funding rate shows sentiment, open interest shows leverage, volume shows activity, and liquidation data shows where volatility may be amplified.
For beginners and intermediate traders, the goal is not to master every advanced model. Start by learning whether the market is overheated, over-shorted, or carrying too much leverage. That alone can help avoid many emotional trades.
Disclaimer: This content is for education and market research only. It is not investment or trading advice. Perpetual futures and crypto assets involve high risk and may cause loss of principal. Always do your own research and manage risk carefully.
ARGUSBTC is a BTC perp signal detection support tool, not a trading system, and it does not automatically execute any trades. All signals are for reference only and do not constitute investment advice. Always do your own research (DYOR) and take responsibility for your own trading decisions.